

Key Performance Indicators (KPIs)
The grid reporting component has been designed to show key performance indicators (KPIs) designed in the data model (or cube) as well as those designed using the Custom KPI within BI Office.
KPIs can be viewed in an in-grid KPI icons or as Gauges, or in parallel using both methods.
- In-grid icons are simpler to view and have many of their visual properties defined by the KPI definition itself.
- Gauges are more flexible, with visual properties being set by the KPI definition as well as client side settings.
KPI Values
Data Model defined KPIs have four different metrics.
- Value - the face value to be shown for the KPI. The value is shown within the grid itself alongside the in-grid KPI icons..
- Goal - This is a goal value, designed by the cube administrator. It can be seen by placing the mouse over an in-grid KPI icon.
- Status - This is a value between -1 and 1 that designates the "status" of the KPI. This value, together with the chosen status image, is used to render the main KPI graphic
- Trend - this is a value between -1 and 1 that designates the "trend" of the KPI. This value, together with the chosen trend image, is used to render the secondary KPI graphic. The trend is displayed using the in-grid KPI icons and also appears as a small red circle within the KPI gauge.
Custom KPI Values
Custom KPIs in BI Office are similar with only three metrics:
- Actual (see "Value" above)
- Target (see "goal" above)
- Status (see "status" above)
Unlike model defined KPIs, Custom KPI status values can have a broad range of values and the band status can be set dynamically. See Custom KPI for more info.
Using KPI's
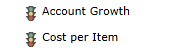
To select KPIs for the current query, go to the Measures dimension and select any KPIs defined in your model.
Model based KPIs appear as mini traffic lights:
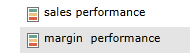
Custom KPIs appear as colored bands
Once selected, a KPI image will appear in the matching grid. KPIs can be resized using the KPI button in the Discovery/Grid Tab.
NOTE: Users can also elect to show NO KPI's in the grid. This is often useful when the Gauges Tab is used to portray KPI values instead.
Visuals
- KPIs have nine status image types:
- Arrow
- Cylinder
- Face
- Gauge
- Reverse Gauge
- Shape
- Sign
- Thermometer
- Traffic Light
- Model based KPIs also have four trend image types:
- Standard Arrow
- Black & White Arrow
- Reverse Arrow
- Face
Home |
Table of Contents |
Index |
User Community
Pyramid Analytics © 2011-2022